RESULTS AND DISCUSSION
Do climate change effects change between meteorological stations?
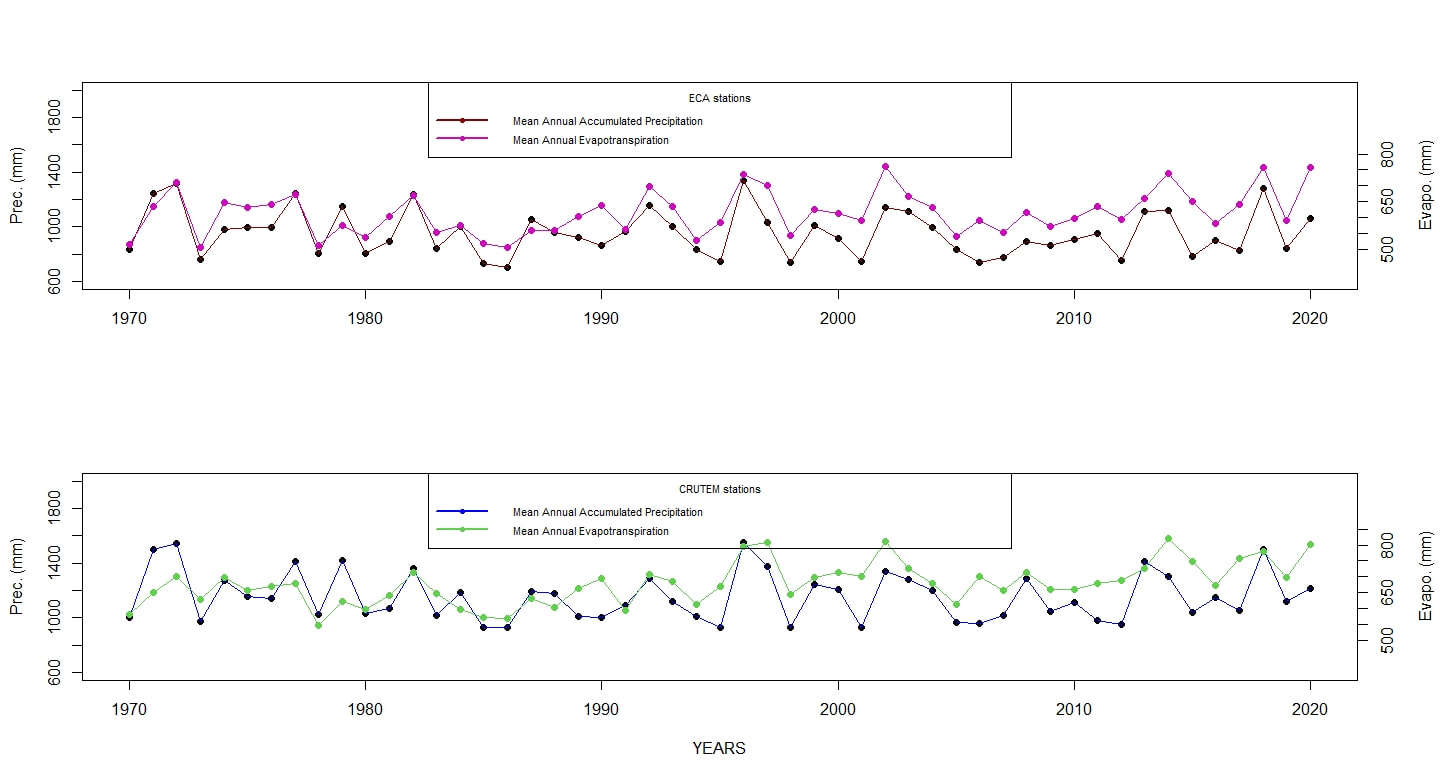
The annual accumulated precipitation and the annual evapotranspiration over time, per station type (meaning that CRUTEM and ECA stations selected for the study), are represented in Figure 5. This representation is merely informative as the station category does not influence the effect of the climatic variables on the area of study. Even though, CRUTEM stations presented higher precipitation values as most of the sites are located in high elevation areas, compared with those from the ECA stations (see Table 1 - section Data and methods). In addition, a high inter-annual variability in pluviometry and evapotranspiration was observed for all the stations.
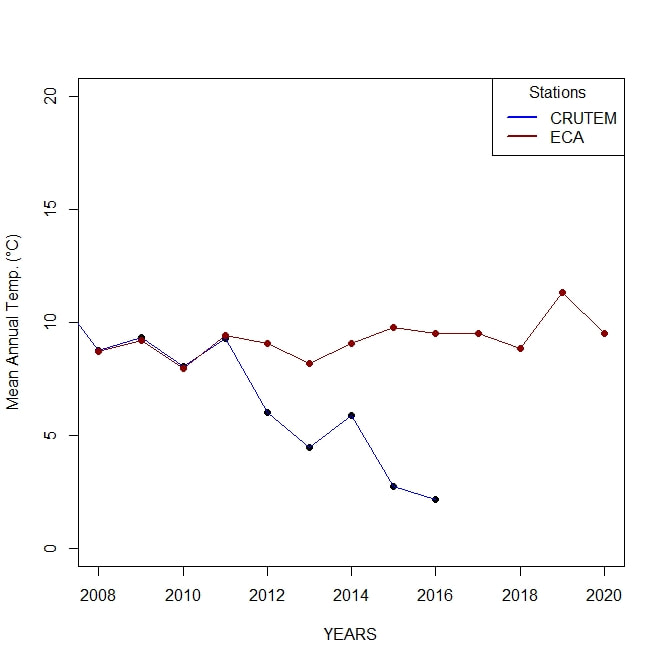
The mean annual temperature (MAT) over time, per station category, is represented in Figure 6. As can be observed, there is a decrease in MAT for the CRUTEM stations from 2011 until 2016, however the temperature observed by the ECA stations remained fairly stable, presenting a slightly increase from 2013 until 2020. The data series obtained from the CRU database presented gaps for the period 2008 -2010 and 2015 onward, Therefore, the information presented in Figure 6 was gathered from just a few CRUTEM stations in which the data was available. In example, only the MAT from the station "Boi", is shown for the years 2015 and 2016. That is why we might observe a decrease in the MAT during this period of time, as less information is available, from high elevation areas, in particular.
The mean annual temperature (MAT) over time, per station category, is represented in Figure 6. As can be observed, there is a decrease in MAT for the CRUTEM stations from 2011 until 2016, however the temperature observed by the ECA stations remained fairly stable, presenting a slightly increase from 2013 until 2020. The data series obtained from the CRU database presented gaps for the period 2008 -2010 and 2015 onward, Therefore, the information presented in Figure 6 was gathered from just a few CRUTEM stations in which the data was available. In example, only the MAT from the station "Boi", is shown for the years 2015 and 2016. That is why we might observe a decrease in the MAT during this period of time, as less information is available, from high elevation areas, in particular.