INTRODUCTION
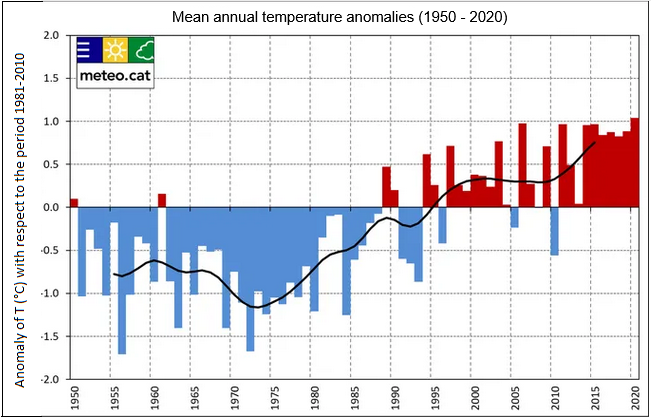
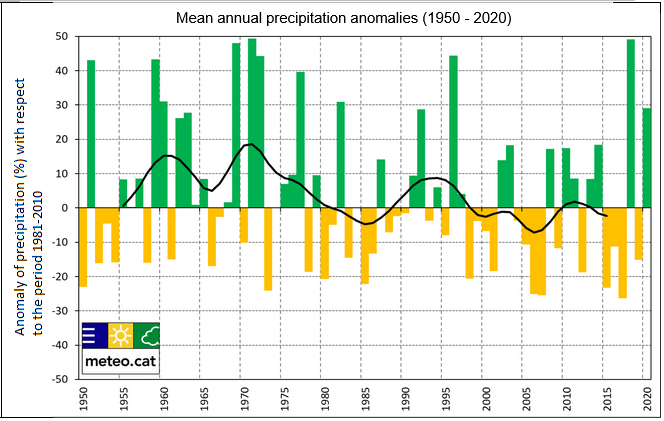
The Catalonia Region is located in the north-east of Spain, within the Mediterranean basin. It is an area sensitive to drought and flooding events, which are becoming more frequent. The shifts in temperature and precipitation patterns are causing a structural water deficit in the region. Since the 1970’s, the main annual temperature in the region has increased significantly and the precipitation has slightly decreased, as can be observed in Figures 1 and 2 [10].
In order to fight the water scarcity and the frequent periods of drought, a set of dams were built in the region, particularly close to mountainous areas. Figure 3 shows the high amount of natural and artificial lakes located on the Pyrenees mountain range, which is considered the natural border between Spain and France.
In order to fight the water scarcity and the frequent periods of drought, a set of dams were built in the region, particularly close to mountainous areas. Figure 3 shows the high amount of natural and artificial lakes located on the Pyrenees mountain range, which is considered the natural border between Spain and France.
|
|
Figure 1 and 2: Anomalies on the mean annual temperature (left) and precipitation (right) in Catalonia Region for the period 1950 - 2010. This shows the annual anomaly in relation to the average value of the reference period 1981 - 2010 (in green if positive, in yellow if negative) and the evolution of the moving average for a 10-year period (black line). Source: meteo.cat
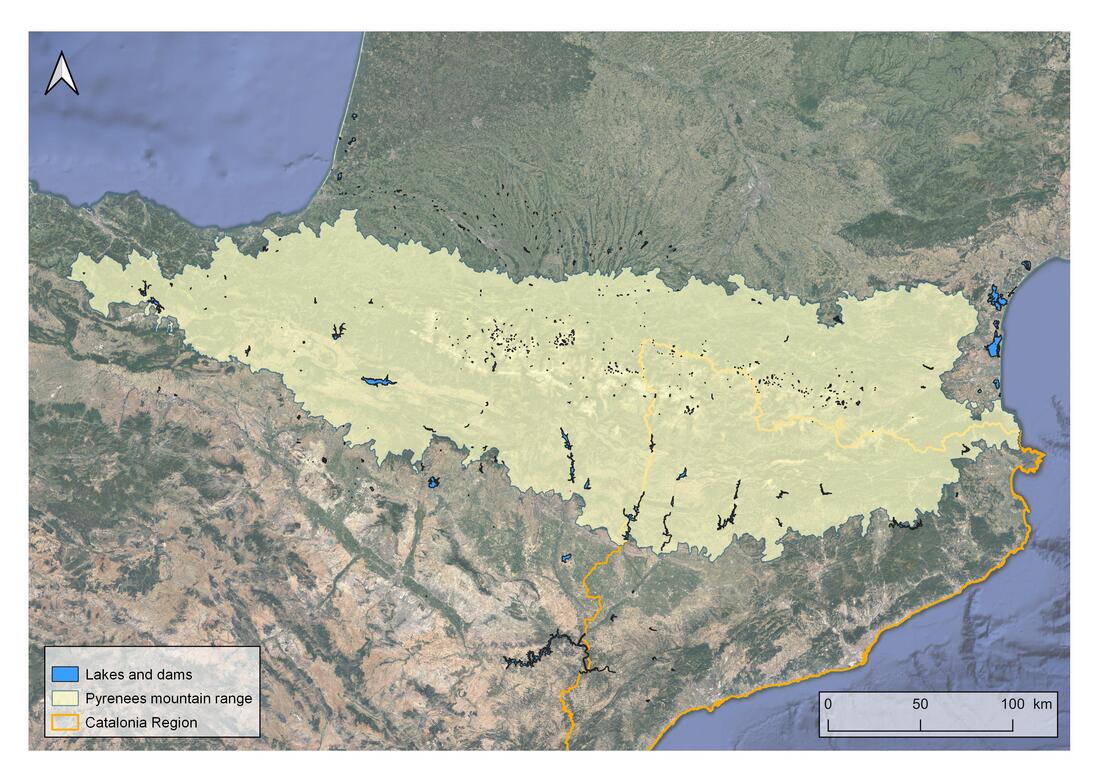
Figure 3: Lakes and dams in the Pyrenees mountain range and nearby areas, located in Catalonia Region, Aragon Region and France. Created using QGIS.
The main challenge when exploring mountainous areas is the lack of historical climatic data. The high elevation combined with a lack of technology were obstacles for monitoring those sites. Nowadays, there is an increase in the number of studies that explore the variability in precipitation and temperature on high elevation areas. Some examples are the researchs carried out by Kuhn, M. and Olefs, M. (2020) [5], Bandopadhyay, S. (2016) [6] and Borodavko, P.S. et al (2018) [7] . In addition, the Pyrenean Climate Change Observatory (OPCC), created the first homogenized single data base covering all the Pyrenees for the period 1950-2010 [2]. Afterwards, this institution created a report that showed a significant increase in mean annual temperature for the whole Pyrenean range, and a slight decrease in annual pluviometry, presenting a high inter-annual variability. These observations can be seen on the Videos 1 and 2, where the anomalies in mean annual temperature and mean annual precipitation for the periods 1981-1990, 1991-2000, 2001-2010 are represented. These videos were created using data from the OPCC geoportal [8] Geoportal | Observatorio Pirenaico del Cambio Climático (opcc-ctp.org).
|
|
|
Video 1 and 2: Anomalies in mean annual temperature (left) and in mean annual precipitation (right) in the Pyrenees mountain range, for the period 1981 - 2010 with respect to the means during 1961 - 1990. Source: OPCC, 2014.
